Shapes of Distribution in Statistics

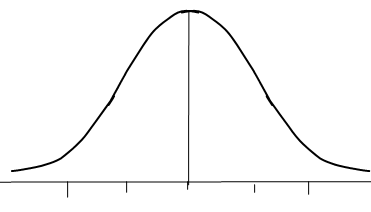
Bell-curve/shape
Perfect distribution with only one peak. Skewness coefficient equal = 0 because the mean equals to the median. Mean=Median= Mode. Skewness = (Mean-Median )/Standard deviation. Left half of the graph is a mirror of the right half of the graph.

U-shaped
Unlike the bell -shape. They have more a u-shape.

Skewed right
Fewer data plots are found to the right of the graph. The tail of the graph is pulled to the right positive direction. The Mean gets pulled towards the tail. Mean>Median>Mode.

Fewer data plots are found to the left of the graph. The tail of the graph is pulled to the left negative direction. The Mean gets pulled towards the tail. Mean<Median<Mode.

Uniform
Data is spread equally across the range. There are no clear peaks.

Measure of Central tendency
Is a value that attempts to describe a data set by identifying the central position of the data set. Measures of central tendency are called Mean, Meadian, Mode.
Modality
The number of peaks contained in a distribution determines the modality of the distribution.
Unimodal — one peak

Biomodal- two peaks

Multimodal- two or more peaks.

Conclusion
Mean = Median in Bell-Shaped distribution.
Large Mean in Distribution skewed to the right.
Large Median in Distribution skewed to the left.
Mean = Median in Uniform Distribution.
Please add your comments or send an email to the author at yamors01@louisville.edu. See you next Article.
